

Jaime de Melo, Emeritus Professor, University of Geneva
For small island economies like Mauritius, their environment and ecosystem are particularly fragile as trade and tourism, the engines of growth, exert pressure on the environment. This note presents an array of indicators of the health of the environment for Mauritius and 7 ‘comparable’ tourist-oriented small islands. Mauritius’ non-environmental performance over the period 1970-2015 is among the best, a reflection of the ‘Mauritian miracle’. However, for most performance indicators, Mauritius underperforms relative to comparators. This lacklustre performance also shows up when an overall composite indicator of environmental performance is plotted against per capita GDP. Mauritius also has a persistently high carbon-intensive energy mix.
In a span of fifty years, Mauritius is at the door of the high-income status according to the World Bank criterion, even reaching it briefly in 2019. Key to this success was the combination of effective policies and adaptation to changing external events cemented by close collaboration between the government, the private sector, unions, and civil society. In the case of Mauritius, economic appraisals have often touted a “Mauritian miracle” reflected in its high growth rates as reflected by the standard United Nations System of National Accounts that ignores depreciation of natural capital.
It is widely accepted that the health of the environment and its ecosystems are particularly fragile in Small Island Developing States (SIDS) because of population pressures, biodiversity loss, and climate-change related pressures to which they are more vulnerable. SIDS depend strongly on international trade. If not accompanied by policies that protect their environment, international trade can then result in the depletion of their natural resources. Tellingly, Pierre Poivre, the precursor of environmental economics was the first to warn about the environmental impact of the ongoing deforestation he was observing in Mauritius in the 18th. Century [1].
Usually, countries take better care of their environment as they become richer, both because citizens put greater weight on environmental quality and because governments have more resources at their disposal. This note contrasts Mauritius’ trajectories of economic and environmental indicators with those of ‘comparable’ tourist-dependent small island economies. Mauritius’ performance is evaluated by comparing the trajectories of several indicators of environmental performance across 7 island economies comparable to Mauritius: Barbados, Cape Verde, Comoros, Dominican Republic, Haïti, Jamaica, Seychelles, Trinidad & Tobago (see population and population densities for each country in the notes to Figure 1). This note will start with a review of the overall non-environmental performance and then turn to indicators of environmental performance. The upshot is that Mauritius has done relatively well on the standard indicators of performance like GDP growth and human development, but less well on the environmental front.
Superior GDP Growth and Human Development
Figure 1 displays the trajectories of two non-environmental indicators for each country over 1970-2015: the Human Development Index Purged of the income per capita component (HDIP) on the vertical axis against Gross National Income (GNI) per capita (logarithmic scale) on the horizontal axis [2]. A relatively flat trajectory shows greater improvement along the material (GNI per capital) dimension. A relatively steep trajectory shows greater improvement along the social HDIP) dimension. Since the time dimension is the same for all countries (except Comoros and Seychelles), long trajectories indicate a sustained performance.
Figure 1: Small Islands Trajectories; Human Development Index (HDIP) and GNI
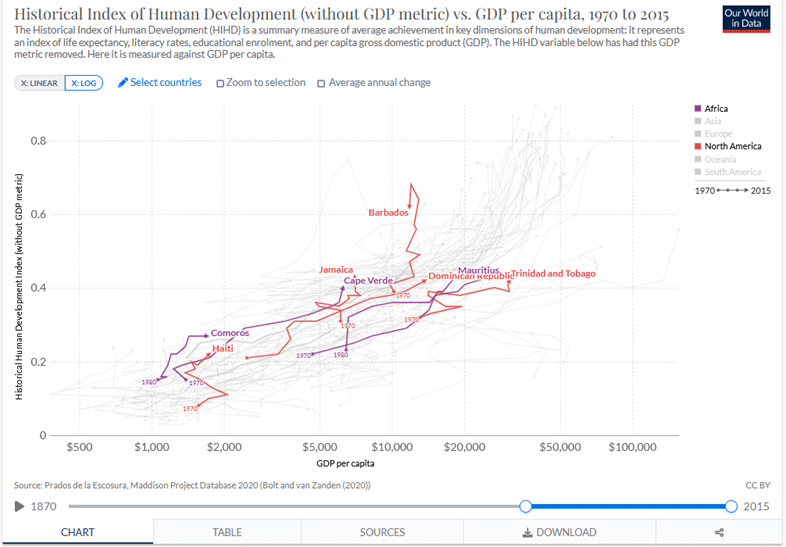
Notes: The purged HDIP index is a geometric weight of its 2 components, health and education. In brackets, population in 1’000 followed by population density per sq km. Data starts in 1980 for Comoros and Seychelles.
Barbados [281;637]; Cape Verde [593;147]; Comoros [837;439]; Dominican Republic [11,200;231 ]; Haïti [11,585;417]; Jamaica [2800;257]; Mauritius [1,300;637]; Seychelles[107;237];Trinidad & Tobago [1500,298]
The group exhibits large differences in performance on both social and economic dimensions. In most cases, strong (weak) performance is observed along both dimensions (HDIP and GNI per capita). Jamaica, Haiti and Comoros display weak performance on social and growth indicators whereas Cape Verde, Jamaica, Mauritius and Seychelles display strong performance along both dimensions reflected in the long fairly regular upward-sloping trajectories. Barbados has a strong performance on the social dimension but no growth.
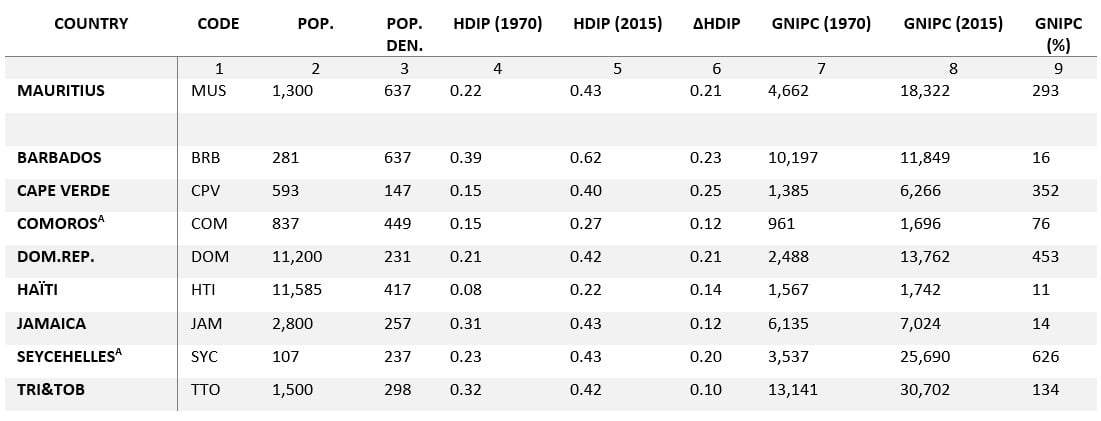
The irregular trajectories for some countries illustrate the importance of shocks, external and or internal, and accompanying policies. The irregular trajectories also remind us of the limits imposed by country idiosyncrasies on any comparative assessment, especially in a small group. Together, Figure 1 and Table 1 show that Mauritius has fared relatively well within this group. Both indicators showed steady improvements over the period justifying a ‘superior’ label.
Table 1: Social (HDIP) and growth (GNI per capita) indicators: Mauritius and comparators
Lacklustre environmental Performance
Turning to the environment, table 2 presents a dashboard of sub-indexes. These are categorized to capture three aspects of environmental challenges facing Mauritius and other island economies: (i) physical vulnerability to climate change; (ii) current health of the environment: (iii) state of preparedness to meet environmental challenges. Each sub-index is an average of components. Part I captures exogenous aspects of environmental performance. Parts II and III capture the impact of environmental policies. Because these indices are ordinal rather than cardinal, rankings are provided along with index values.
Table 2: Environmental Dashboard for small islands
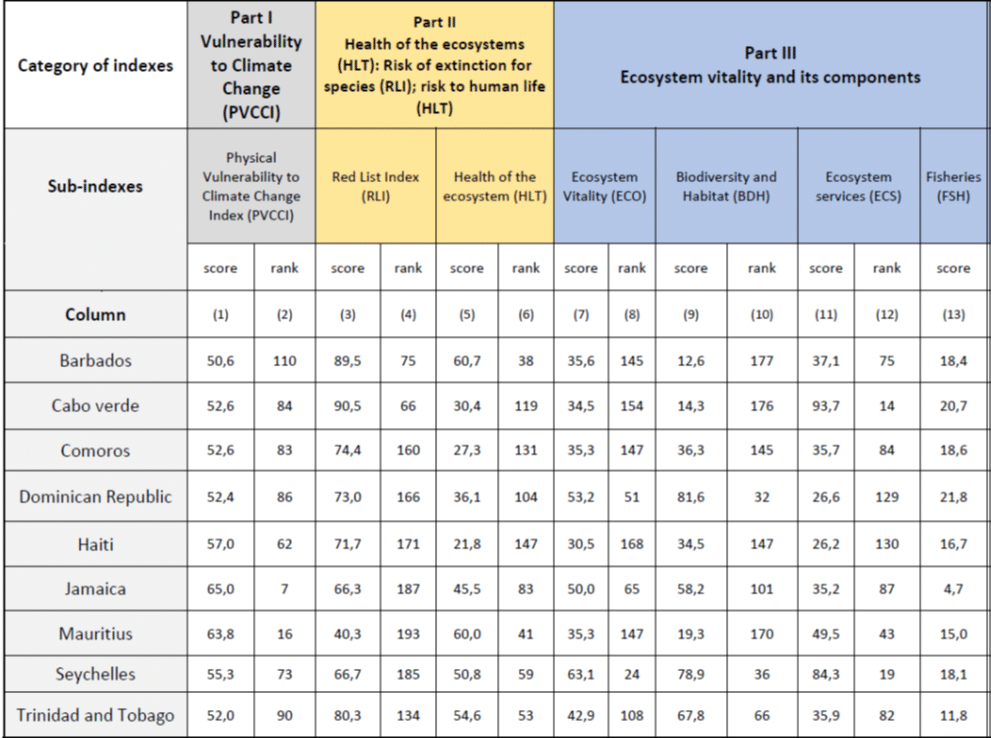
Mauritius is the second most vulnerable country to climate change in the group. Because they have lost endemic species, though they still have non-extinct endemic species, Mauritius and Seychelles are at the greatest risk of species extinction (low rank on the RLI). Indeed, Mauritius ranks last on the RLI index. Mauritius has a high rank in the group on the health of the ecosystem (HLT) but has a low rank on ecosystem vitality (ECO) because of low scores on index values for fisheries (FSH), for ecosystem services (ECS), and risk of species extinction (RLI).
Figure 2 plots the values of an Environmental Performance Index for Small Islands (EPISI) which is a geometric average of the HLT and ECO sub-indices. The EPISI omits Green House Gas (GHG) emissions on the grounds that since benefits of abatement accrue beyond the borders of small countries, they are not directly affecting the quality of the environment for tourism (but see figure 3 on progress at reducing GHG emissions.) As shown in Casella and Melo (2023), Mauritius performs below the fitted curve for the group of comparator tourist islands. Compared with the other tourist-oriented island economies, at per capita income level, Mauritius’ performance is ‘lacklustre’, below Seychelles (‘superior’), Dominican Republic and Jamaica.
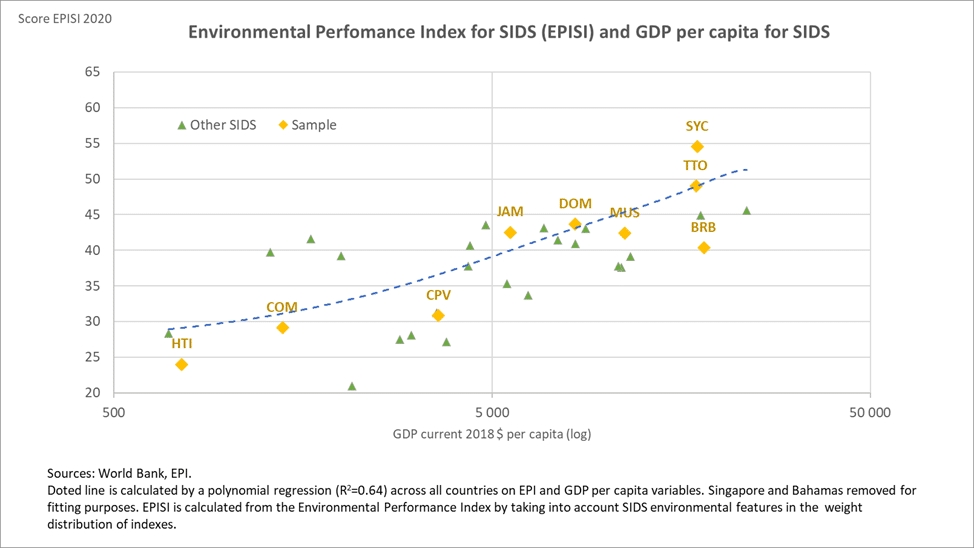
Notes: A higher score indicates a better overall environmental performance. Fit is over group of 8 island economies
Decarbonization yet to start
Decarbonization is the reduction (or removal) of CO2 output into the atmosphere. It is the start on the path towards the declared zero net CO2 emissions objective by all countries. Relative decoupling occurs when CO2 emissions grow less rapidly than GDP. Absolute decoupling occurs when CO2 emissions stagnate or display negative growth. Relative decoupling is an indicator of progress towards zero net emissions. Over the period 1995-2015– the period with CO2 emissions data available for a large number of countries—no country in the group of islands has started to decarbonize. Only Cabo Verde and Dominican Republic each had an episode of relative decoupling.
Over the period 1995-2005, Mauritius had the highest rate of carbonization next to Trinidad and Tobago (TTO) with emissions growing twice as fast as GDP. The situation improved over the next decade, yet CO2 emissions were still growing faster than GDP. Relative decoupling has not started for Mauritius over 1995-2015.
Figure 3: Decadal growth rates: CO2e emissions vs. GD for tourist-dependent islands
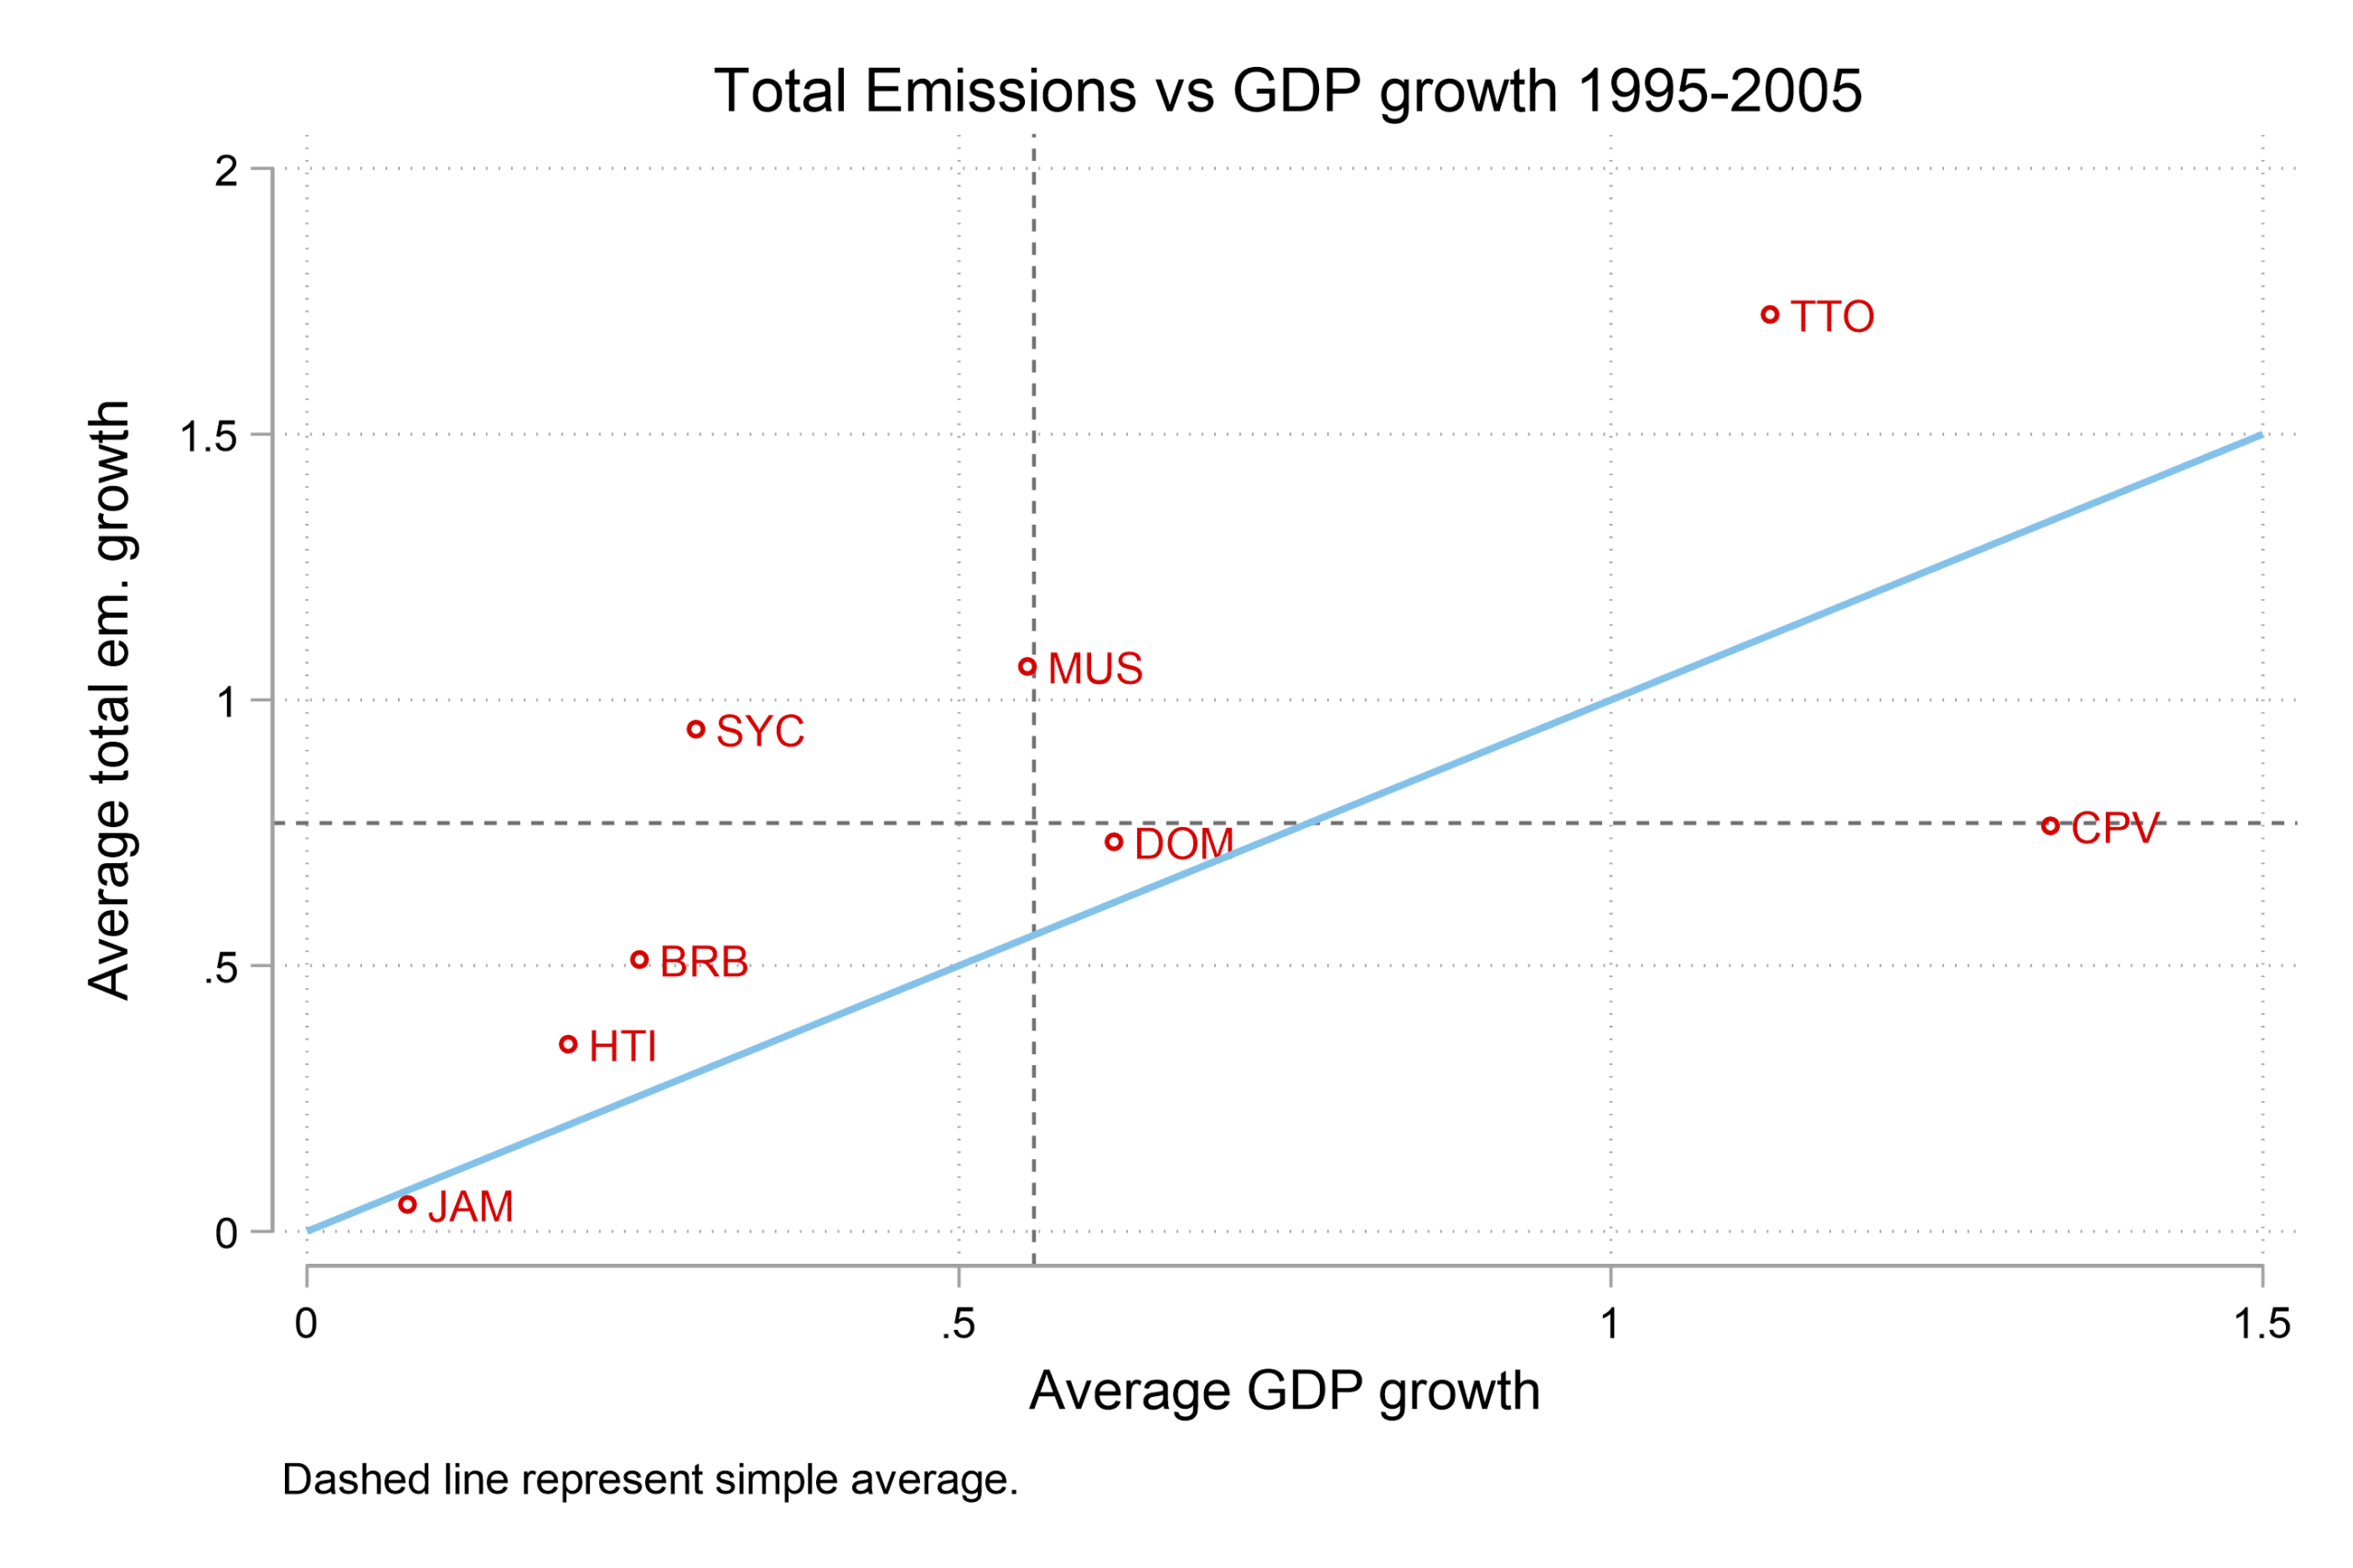
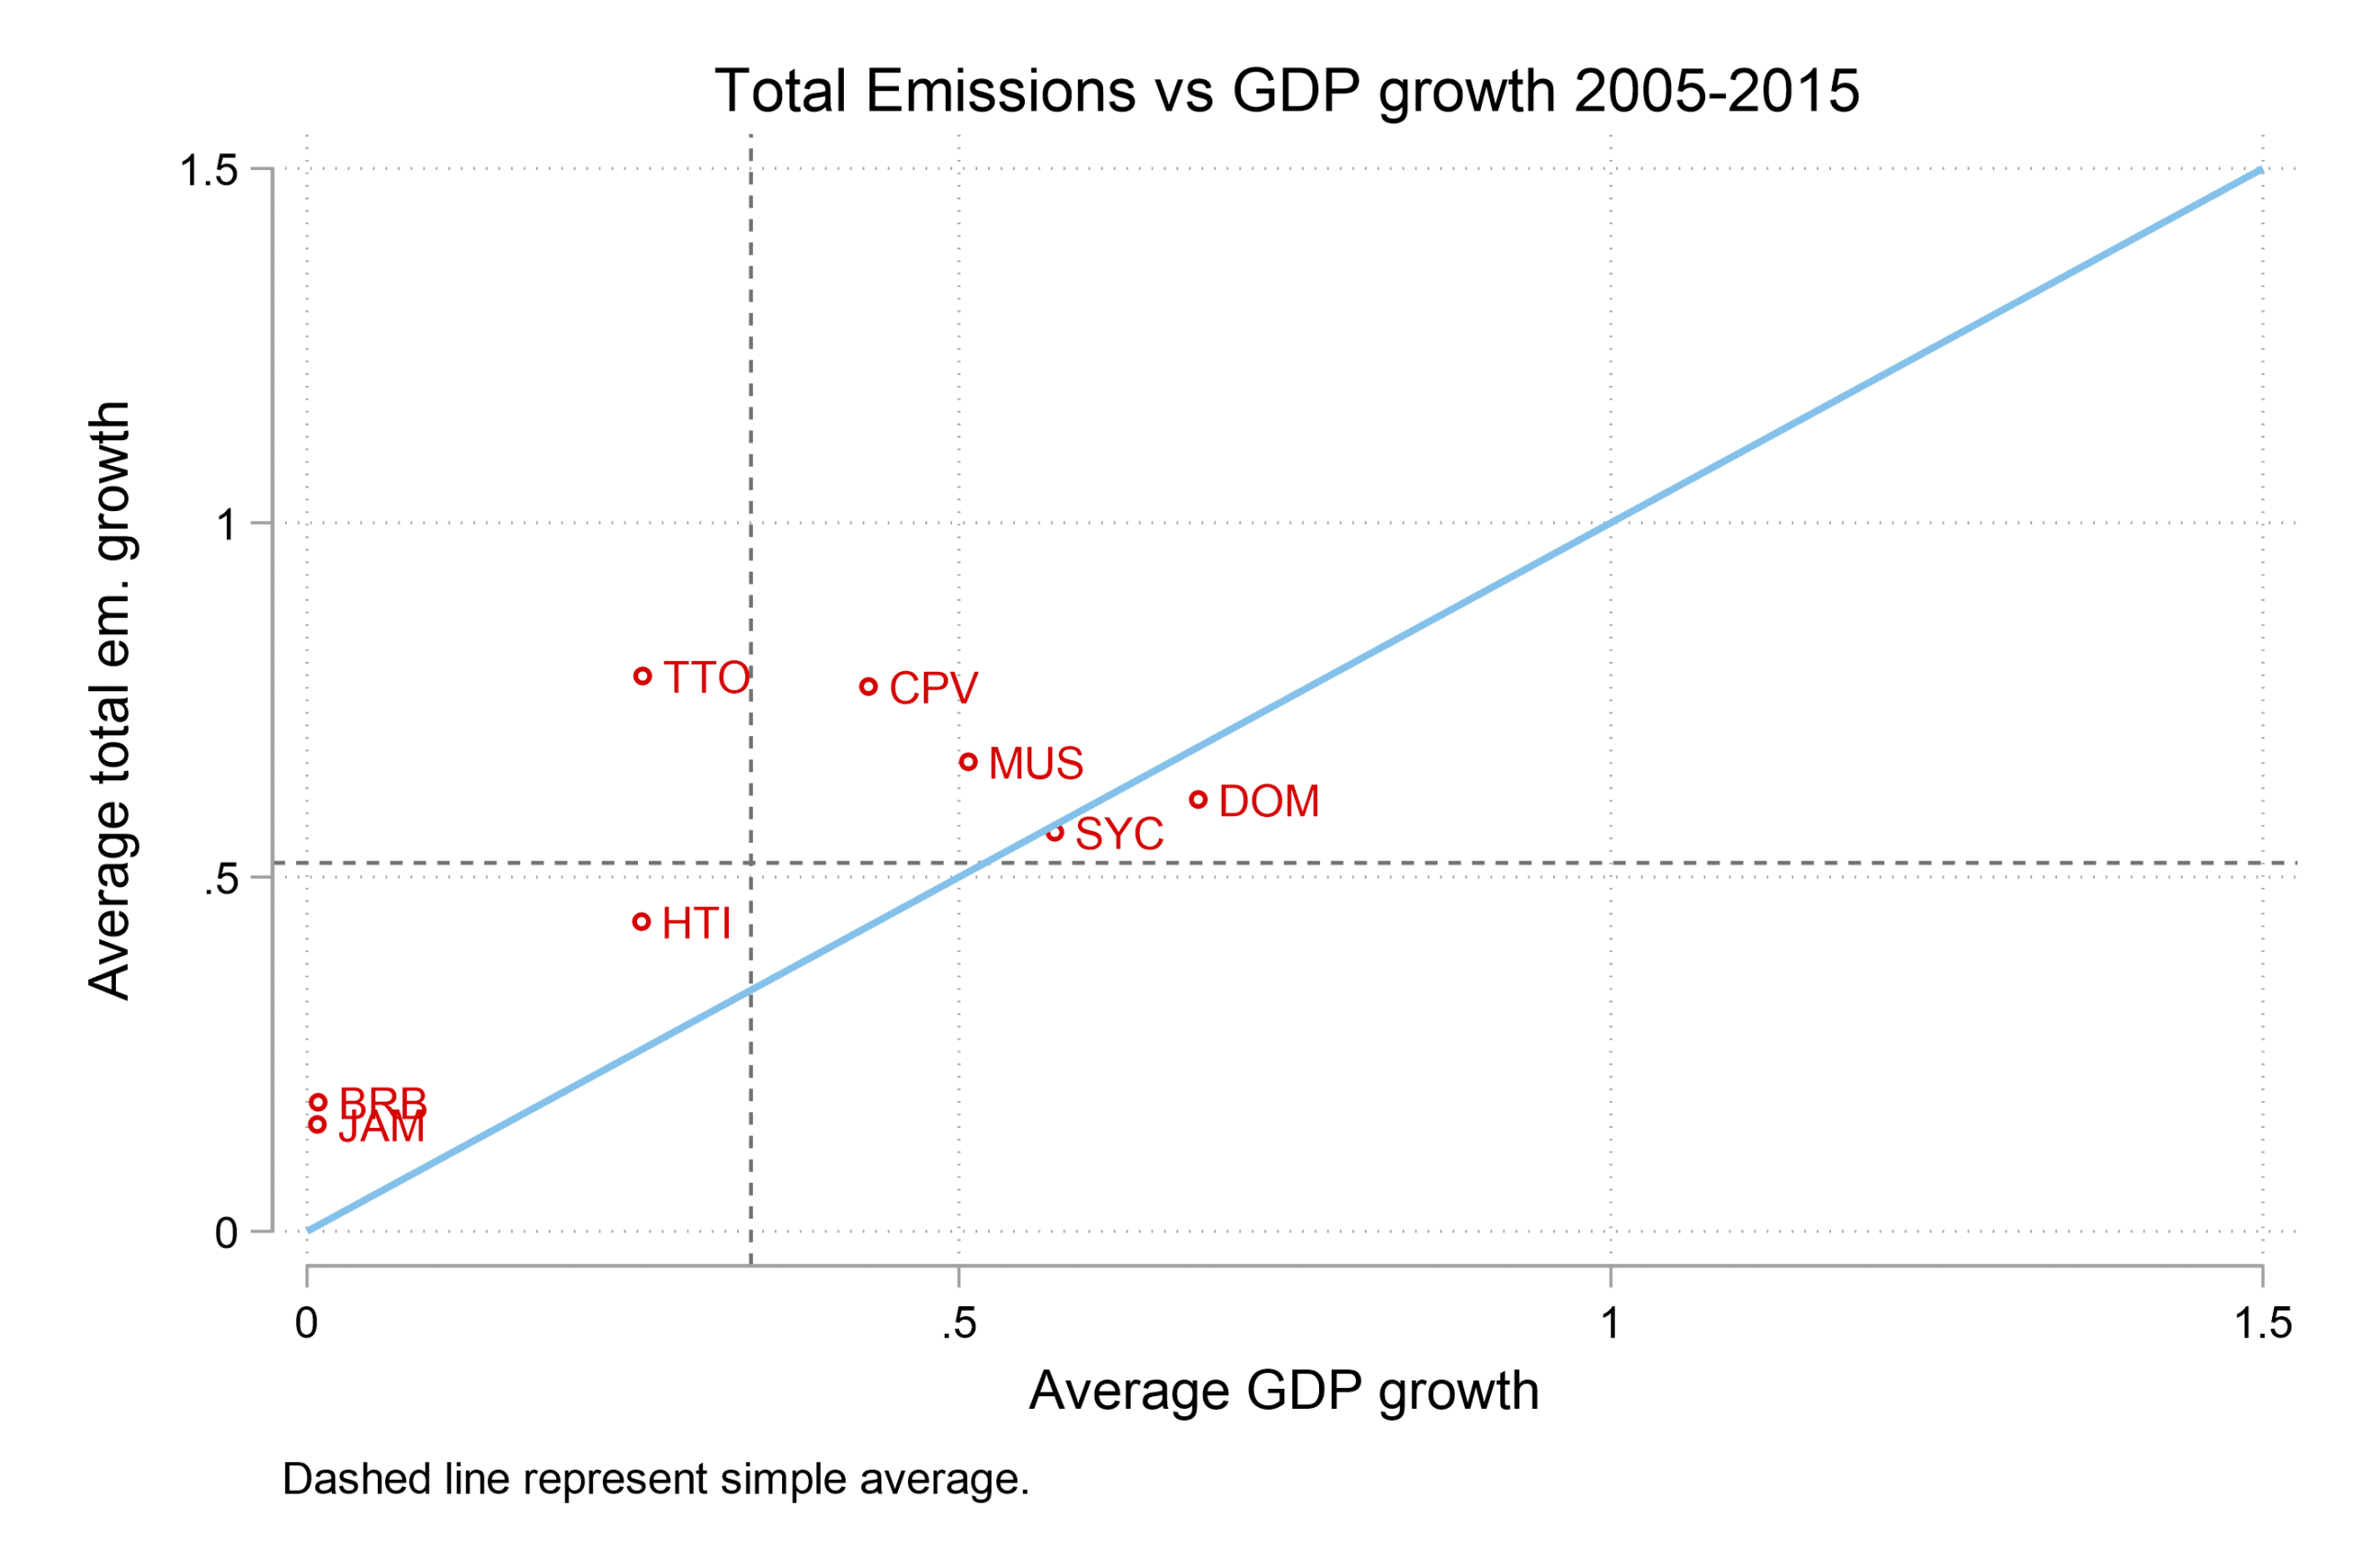
Notes: Values represent growth over the decade. Vertical and horizontal dashed lines indicate simple average growth rates for GDP and CO2 emissions, respectively, over the sample. Intersection of the two lines below (above) the 45° line indicates that average emissions are growing slower (i.e., decoupling) or faster (i.e., carbonizing) than average GDP. On average, SIDS are carbonizing over both periods. ISO country codes in Table 1.
To summarize, Mauritius’ CO2 emissions per capita target in the Millenium Development Goals (MDGs) for 2015 was already off-track in 2010. Per capita emissions have continued to grow every year, reaching 5.3Tco2e per capita in 2018 – 38% above the 2030 target. And Mauritius’ carbon intensity of electricity was 601g CO2e per KW in 2021. This is 24 percent higher than the average for the upper-middle- income group of countries to which Mauritius belongs and it is 71 percent above the average for the high-income group Mauritius is aspiring to rejoin [3].
Moving forward
Figure 2 shows that Mauritius performs below average on the protection of its environment for its per capita income (a pattern also observed but not shown here when the comparison is extended to all countries). Mauritius is a carbon-intensity electricity country is also significantly above the average of the World Bank’s Upper-middle income category.
This lacklustre performance also extends when evaluation is extended to commitments on other components of the environment like biodiversity. During the negotiations at the Aichi Convention on Biological Diversity, Mauritius pledged to protect 17% of terrestrial and inland water as well as 10% of coastal habitat (Target 11) by 2025. As of 2019, according to Mauritius’ National Voluntary Review (VNR) on SDG targets, only 4.725 % terrestrial area and 0.003% of marine and coastal area are protected.
But progress is on the way. In 2020, as part of its commitments to reach its SDG7 energy target, Mauritius submitted a compact for the next ten years stipulating a list of specific objectives for 2030. The compact is available from the Mauritius Renewable Energy Agency (MARENA). The detailed list includes: 60% renewable in the energy mix; increase efficiency of electricity delivery by 10%; phasing out of coal for power generation by 2030. The document also lists specific accompanying measures (e.g., an increase in battery energy storage, a levy on energy inefficient appliances, labelling, etc…) to help meet these objectives.
This recent shift to presenting objectives progress in terms of easily quantifiable metrics is commendable. However, the government should produce regular updates. For example, for transition towards a renewable electricity mix, updates should be produced on a biennial basis until 2030. Also, different transition scenarios towards renewable energy should be carried out as done recently by Selosse et al. (2018) for Reunion’s “renewable energy revolution” [4].
These updates should be disseminated widely to the public (and discussed in parliament). Only through a greater visibility in the public discourse will the environment figure more prominently in the country’s objectives and slippages of the past be avoided.
[1] Describing Poivre’s instructions in his Règlement Economique of 1769 to prevent deforestation, Brouard (1963), cited in Techera (2019), wrote “‘… hasten to control it [deforestation] with a good policy … examine the existing regulations on this subject, study the exact condition of the forests, exploit and utilise them in the most economical way possible, and only allow people to cut them if they ensure their conservation. This will be the object of a provisional regulation after which … a general forest policy and law will be set for all the forests of the two islands… “text in brackets added.
[2] To ease the interpretation of figure 1, table 1 details the starting and end values for both indicators.
[3] Source: Our World in Data. Income group categories from the World Bank
[4] The bottom-up optimization TIMES model they use to evaluate alternative pathways to achieve a 100 percent transition from coal to renewables by 2030 through a combination of biomass, hydro, wind, and solar would be easily adaptable to Mauritius.
Bibliography
Casella, Henri, and Jaime de Melo (2023) “Taking Seriously the Move to Green Growth: Screening Dimensions of Environmental Progress in African SIDS”, Charles Telfair Centre. https://charlestelfaircentre.com/taking-seriously-the-move-to-green-growth-screening-dimensions-of-environmental-progress-in-african-sids/
MARENA (2021) SDG7: Energy Compact of Mauritius
Melo, Jaime de (2023) “Environmentally-friendly trade policies to shape Mauritius’ future” FERDI WP#315, https://ferdi.fr/en/publications/environmentally-friendly-trade-policies-to-shape-mauritius-future.
Melo, Jaime de and Jean-Marc Solleder (2023) “The Landscape of CO2 emissions across Africa”, The World Economy, 46(11).
Selosse, S., S. Garabedian, O. Ricci, N. Maïzi (2020) “The Renewable energy revolution of Reunion Island”, Renewable and Sustainable Energy Reviews, vol 89, 99-105
Wendling, Z. A., Emerson, J. W., de Sherbinin, A., Esty, D. C., et al. (2020). 2020 Environmental Performance Index Report and Technical appendix: New Haven, CT: Yale Center for Environmental Law & Policy. https://epi.yale.edu/
Main photo by IPSNews on Flickr.
Charles Telfair Centre is an independent nonpartisan not for profit organisation and does not take specific positions. All views, positions, and conclusions expressed in our publications are solely those of the author(s).